
The world in which we live is clearly a three dimensional (3-D) world. All physical objects have three dimensions along which they can be measured: length, width, and height. To be precise we need to understand exactly what we mean when we refer to a "dimension". According to the online dictionary at Princeton (1), a dimension refers to "the magnitude of something in a particular direction" or "a construct whereby objects or individuals can be distinguished" (i.e. a property or attribute of a given object that differentiates it from other similar objects). We will take the second definition as the principal meaning for the following discussion.
Let us consider two rectangles. To easily reference these rectangles, label one as A and the other as B. Suppose A is colored yellow and has length 4 units and width 2 units, while B is colored blue and has length 2 units and width 2 units. Thus there are three properties, or dimensions, which differentiate A from B: length, width, and color.
|

|
| A | B |
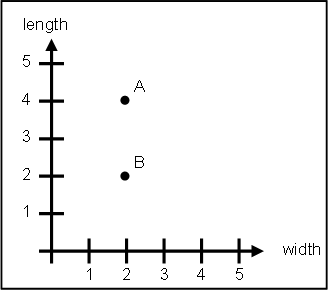
Graphically we can represent each rectangle as an ordered pair in the width-length plane.
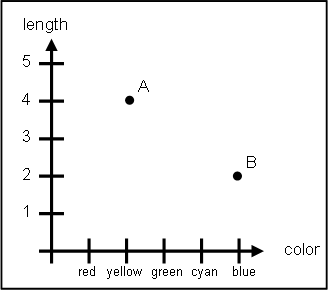
We can also graphically represent each rectangle as an ordered pair in the color-length plane. Actually, a color could be better represented as a combination of the basic colors: red, green, and blue, but we will ignore this fact for the sake of simplicity.
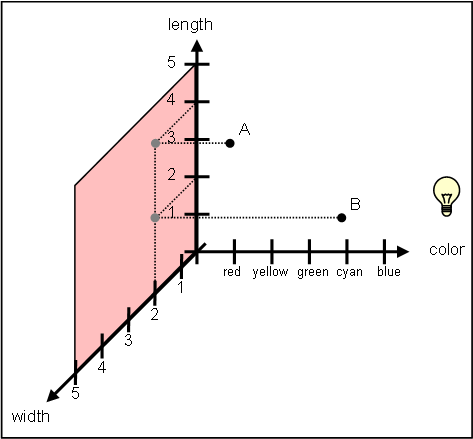
If we combine these two graphs together, we obtain a 3-D graph representation for A and B.
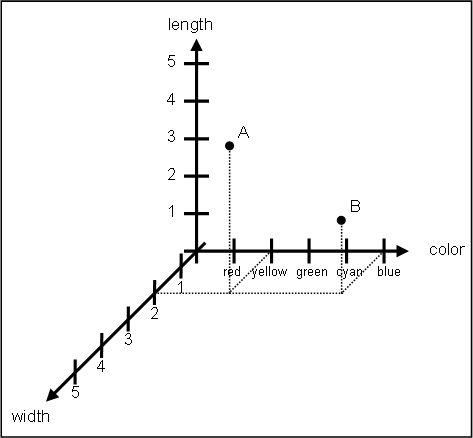
Notice that since A and B are both 2 in the width dimension that the graphical representation in terms of color vs. length is just a "slice" of the 3-D graph, if the slice is a plane passing through 2 on the width axis. Actually, the first two graphs are just "projections" of the 3-D graph where we disregard one dimension.
The term projection stems from the concept of light casting shadows of 3-D objects onto a 2-D surface such as a wall. Imagine placing a spot light to the right of the points in the 3-D graph and shining the spotlight towards the "wall" formed by the width and length axis.
The graph projected onto the colored plane should look identical to the width-length graph shown earlier. This is due to the projection suppressing the color dimension. This concept of a projection will become extremely useful as we explore higher dimensions since we can only graph all dimensions at the same time if there are three or less dimensions.
To help us ease into this notion of dimensions greater than three we represent the above 3-D graph as several 2-D graphs "hanging off" a 1-D axis. Compare this closely with the 3-D graph and make sure you see the relationship between the two.

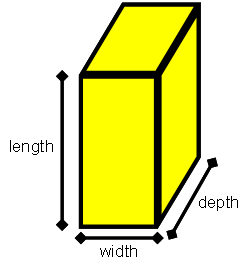
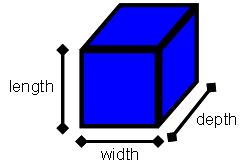
Now suppose that the objects A and B are not just 2-D rectangles, but are 3-D cubes, where A has depth 3 units, and B has depth 2 units.
|
|
| A | B |
To represent the A and B boxes we can take the above graph and add a depth dimension to each of the 2-D graphs which hang off the color axis so that we now have 3-D "worlds" hanging off the color axis.

In this simple example, we have investigated a 4-D space which can be used to categorize all sizes and colors of plastic boxes. If we were to allow the boxes to be made of some other material such as wood or metal we could add another dimension for the material and obtain a 5-D space. The continutation of this line of thought is easily seen and while you may have shuddered at the thought of using five dimensions to describe a simple plastic block before reading this article you can now hopefully appreciate how natural such concepts are.
If you are interested in seeing more everyday examples of n-dimensional objects check out the page on n-dimensional objects or the page about everyday metric spaces.
Last updated: 6/13/09 Submit comments here